Morrie’s law plus one

John Cook tweeted, from his account Analysis Fact

I responded that

The third of these was somewhere in my head; the first one is trivial; I had to play around a bit to find the second one. These all have in common that:

  • the arguments are all whole numbers of degrees (which isn’t as arbitrary as it sounds, that’s from a set of rational multiples of π)
  • the product with n terms is 1/2n.

So what’s going on here? It’s probably a bit more revealing to write the identities in terms of cosines:

cos 60° = 1/2
cos 36° cos 72° = 1/4
cos 20° cos 40° cos 80° = 1/8

as now the arguments are in geometric progression, each one double the previous. Let’s prove the third one. Recall the double angle formula sin 2x = 2 sin x cos x – from this it follows that

sin 40° sin 80° sin 160° = (2 sin 20° cos 20°) (2 sin 40° cos 40°) (2 sin 80° cos 80°)

and cancelling gives

sin 160° = 8 sin 20° cos 20° cos 40° cos 80°

Finally sin 160° = sin 20°, giving the result. Essentially this is an “octuple angle formula”

sin 8x = 8 sin x cos x cos 2x cos 4x

which is one of a family

sin 2x = 2 sin x cos x
sin 4x = 4 sin x cos x cos 2x
sin 8x = 8 sin x cos x cos 2x cos 4x

where the formula for sin 2kx can be derived by applying the double angle formula k times. Then we set x to be π/3, π/5, π/9 in order that the sines cancel; since 3, 5, and 9 are all factors of 180 these look nice in degrees. But the next entry there is π/17, giving the identity

cos π/17 cos 2π/17 cos 4π/17 cos 8π/17 = 1/16

which I won’t even bother to write in degrees. But say we take x not as π/17, but as π/15, or twelve degrees, which gives sin 16x = -sin x. Then you have

sin 192° = 16 sin 12° cos 12° cos 24° cos 48° cos 96°

and the sines cancel to leave a negative sign. That gives

-1/16 = cos 12° cos 24° cos 48° cos 96°

and taking complements yields the identity Cook gave. So it’s not exactly the next member of the family, but it’s not far off. Colin Beveridge observed that “I believe Morrie’s law is the furthest this can be taken with integer-degree angles” but this goes one further.

Historical note: The three-factor identity is known as Morrie’s law, after a boy named Morrie Jacobs, known to Richard Feynman but apparently otherwise lost to history. James Gleick had it, in his biography of Richard Feynman, that “If a boy named Morrie Jacobs told him that the cosine of 20 degrees multiplied by the cosine of 40 degrees multiplied by the cosine of 80 degrees equaled exactly one-eighth, he would remember that curiosity for the rest of his life, and he would remember that he was standing in Morrie’s father’s leather shop when he learned it.”
Translate “ELEVEN PLUS TWO = TWELVE PLUS ONE” into Spanish

The Spanish translation of “ELEVEN PLUS TWO = TWELVE PLUS ONE” is “ONCE MAS CUATRO = CATORCE MAS UNO”.

Why?

  • both of these are anagrams, with the same multiset of letters on the left and right sides;
  • both are mathematically true (11 + 2 = 12 + 1, and 11 + 4 = 14 + 1).

(Or perhaps TRECE MAS DOS = DOCE MAS TRES, but that’s not as good in Mark Dominus’ sense since it involves less rearrangement of the letters – you can just swap “CE” and “S”)

Etymologically this all makes sense. “Eleven” descends from Old English enleofan, literally “one left”, and “twelve” from Old English twelf, literally “two left”. Spanish “once” is more straightforward – it descends from Latin “undecim”, from “unus” (one) and “decim” (ten); and “catorce” is from Latin “quattuordecim”, from “quattuor” (four) and “decim” (ten). And Latin “unus”, “quattuor” give Spanish “uno”, “cuatro”.

I’d known about the English anagram before. I had thought the Spanish ones were new, but it seems to be an independent rediscovery. I came to this problem through this reddit thread, where the poster Lucpel18 wondered if it was possible to solve a system with for example

o \times n \times e = 1

t \times w \times o = 2

and so on. This can be done up to 10. It can’t be done for 12 and the obstruction is precisely the anagram above. In looking through the comments to that Reddit post I found a link to some previous investigations by Lee Sallows, in which he finds the Spanish anagram.

But it’s not possible to assign the letters in English (or any language with a similar numbering system) a value so that the value of all number-word is just the sum of its letters. Why not?

Constructive argument. SEVENTY-SIX and SIXTY-SEVEN have the same letters but do not have the same numerical value. (In German: FUNFUNDVIERZIG and VIERUNDFUNFZIG, that is, “five-and-forty” and “four-and-fifty”.)

Fancy argument. The lengths of the words for numbers only grow logarithmically in the size of the numbers. (This suggests the original multiplicative formulation… but we still have that pesky little obstruction at 67 and 76.)

Percentage of songs with parentheses in the title

AgentRocket, at Metafilter, asked a few weeks ago for modern song names with parentheses, saying that it’s hard to find songs after about 2000 with parentheses in the title. officialcharts.com explains why: version control (this will come up later), to make songs easier to find, to cut down long titles, and so on. And as far back as 1994 critics were commenting on this. This reminded me of a segment of Good Job, Brain! that I’d heard, which was a quiz on such songs… which did, in fact, tend to be from pre-2000. Here’s a list of the songs in the podcast segment (the segment goes from 31:50 to 51:00):

Gypsy Woman (She’s Homeless) – Crystal Waters, 1991
The 59th Street Bridge Song (Feelin’ Groovy) – Simon and Garfunkel, 1966
(I Can’t Get No) Satisfaction – The Rolling Stones, 1965
It’s the End of the World as We Know It (And I Feel Fine) – R.E.M., 1987
St. Elmo’s Fire (Man in Motion) – John Parr, 1985 (from the movie soundtrack)
(I’ve Had) The Time of My Life – Bill Medley and Jennifer Warnes, 1987 (from the Dirty Dancing soundtrack)
I’d Do Anything for Love (But I Won’t Do That) – Meat Loaf, 1993 [sic, even though it’s “I would do anything for love” in the song]
Escape (The Piña Colada Song) – Rupert Holmes, 1979
Christmas (Baby Please Come Home) – Darlene Love, 1963
(You Gotta) Fight for Your Right (To Party!) – Beastie Boys, 1986
Hard Knock Life (Ghetto Anthem) – Jay-Z, 1998
(You Make Me Feel Like) A Natural Woman – Aretha Franklin, 1967
Against All Odds (Take a Look at Me Now) – Phil Collins, 1984
Norwegian Wood (This Bird Has Flown) – The Beatles, 1965

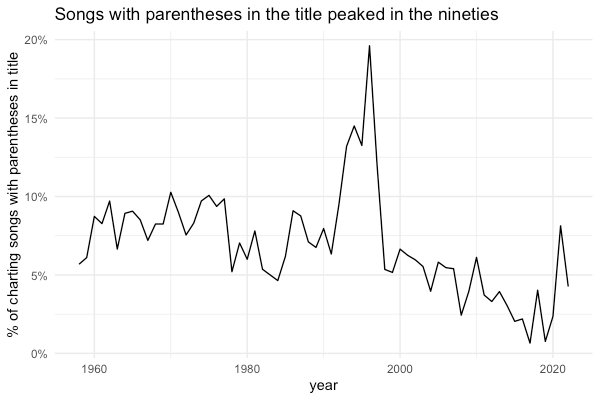
Nothing after 2000. Is this because of what the author of the quiz knows, or is it harder to find songs in this century with parentheses in the title? Well, we’ll need a list of songs. Fortunately Sean Miller has scraped the Billboard Hot 100 charts going back to the chart’s beginning in 1958. This represents a total of 30,444 songs from 1958-08-02 to 2023-01-07. And with a dozen or so lines of R we can make a nice plot. The only tricky thing is the filter(time_on_chart = 1). Miller’s file has a row every time a song appears on the chart, but I wanted to only count each song once, and fortunately he’s included a variable that lets me do exactly that: time_on_chart is “the running count of weeks (all-time) a song_id has been on the chart”.

library(tidyverse)
hot_100 = read_csv('https://raw.githubusercontent.com/HipsterVizNinja/random-data/main/Music/hot-100/Hot%20100.csv')

hot_100 %>% filter(time_on_chart == 1) %>% 
  mutate(has_paren = grepl('\\(', song) & grepl('\\)', song)) %>%
  mutate(year = lubridate::year(chart_date)) %>% 
  group_by(year) %>% 
  summarize(n = n(), has_paren = sum(has_paren), paren_rate = has_paren/n) %>% 
  filter(year < 2023) %>%
  ggplot() + geom_line(aes(x=year, y=paren_rate)) +
  theme_minimal() + 
  ggtitle('Songs with parentheses in the title peaked in the nineties') +
  scale_y_continuous(labels = scales::percent, name = '\\% of charting songs with parentheses in title')

But what’s going on in 2021? Let’s drill down:

hot_100 %>% filter(time_on_chart == 1) %>% 
    mutate(has_paren = grepl('\\(', song) & grepl('\\)', song)) %>%
    mutate(year = lubridate::year(chart_date)) %>% filter(year == 2021 & has_paren) %>% select(chart_date, song, performer)

This returns 53 songs, of which the first 10 (alphabetically) are:

2021-11-2722 (Taylor’s Version)Taylor Swift
2021-01-02Adderall (Corvette Corvette)Popp Hunna
2021-12-04All Night Parking (Interlude)Adele With Erroll Garner
2021-11-27All Too Well (Taylor’s Version)Taylor Swift
2021-11-27Babe (Taylor’s Version) (From The Vault)Taylor Swift
2021-11-27Bad Man (Smooth Criminal)Polo G
2021-11-27Begin Again (Taylor’s Version)Taylor Swift
2021-11-27Better Man (Taylor’s Version) (From The Vault)Taylor Swift
2021-04-10Big Purr (Prrdd)Coi Leray & Pooh Shiesty
2021-12-11Christmas Tree Farm (Old Timey Version)Taylor Swift

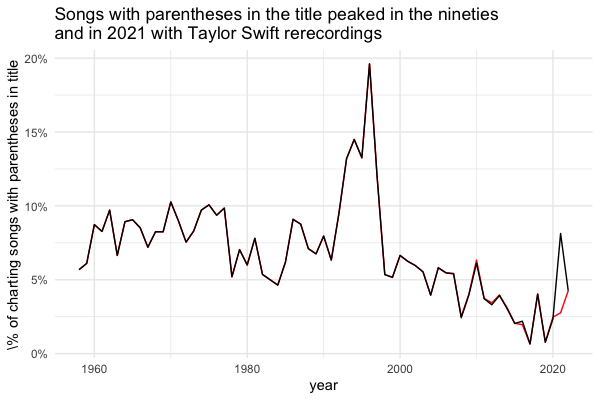
Taylor Swift has been re-recording her first six albums, which she doesn’t own the masters to; in April she released her first re-recording, Fearless, and in November, Red. In 2021, 53 of 652 charting songs had parentheses in the title… including 36 of 37 charting songs where the artist name included the string Taylor Swift. (The exception is a song that only featured her, Renegade, by Big Red Machine.). So let’s redo the chart:


hot_100 %>% filter(time_on_chart == 1) %>% 
  mutate(has_paren = grepl('\\(', song) & grepl('\\)', song)) %>%
  mutate(taylor = grepl('Taylor Swift', performer)) %>%
  mutate(year = lubridate::year(chart_date)) %>% 
  group_by(year) %>% 
  summarize(n = n(), paren_total = sum(has_paren), paren_rate = paren_total/n,
            paren_no_taylor_total = sum(has_paren & !taylor),
            no_taylor_total = sum(!taylor),
            paren_no_taylor_rate = paren_no_taylor_total/no_taylor_total) %>% 
  filter(year < 2023) %>%
  ggplot() + geom_line(aes(x=year, y=paren_no_taylor_rate), color = 'red') +
  geom_line(aes(x=year, y=paren_rate), color = 'black') +
  theme_minimal() + 
  ggtitle('Songs with parentheses in the title peaked in the nineties\nand in 2021 with Taylor Swift rerecordings') +
  scale_y_continuous(labels = scales::percent, name = '\% of charting songs with parentheses in title')

Essentially, the entire 2021 spike, like so many things in the music industry now, was due to Taylor Swift.

Is Hanukkah’s new moon always the darkest one?

My second child was born on the day of the new moon, closest to the winter solstice, in the darkest year in recent memory (that is, 2020). I remember there was a new moon because there was a solar eclipse that day.

In the year of her birth, her birthday fell during Hanukkah. Maybe the new moon that falls during Hanukkah – Rosh Chodesh Tevet – is always the new moon closest to the winter solstice?

Basic information about the Hebrew calendar that’s relevant for this post:

  • a year in the Hebrew calendar consists of 12 or 13 months – 12 in “common” years and 13 in leap years. Leap years are 7 years out of 19, following the Metonic cycle.
  • in theory these months start at the new moon;
  • but the beginning of the year can be postponed (not preponed) so that, for example, Yom Kippur (the tenth day of the year) doesn’t fall on a Friday or Sunday – the exact circumstances under which those adjustments are made are beyond the scope of this post;
  • the months alternate between 29 and 30 days, with the odd months having 30 and the even months having 29, summing to 59 x 6 = 354… except that if things work out so that the year should be lengthened by a day.then the second month (Cheshvan) is 30 days, and if they work out so that the year should be shortened by a day then the third month (Kislev) is 29 days.

So Hanukkah starts on the 25th of (the third month) Kislev, and ends on the 2nd or 3rd of (the fourth month) Tevet. Rosh Chodesh Tevet, the first day of the fourth month, is either the sixth night of Hanukkah (if Kislev is short) or the seventh (if Kislev is long).

To answer the original question – no, this post follows Betteridge’s law. Thinking through the theory:

  • Passover is always the first full moon after the spring equinox, so between 0 and 1 lunar months after the equinox
  • from Passover (15 Nisan, year N) to the following Rosh Chodesh Tevet (1 Tevet, year N+1) is 8.5 lunar months
  • so from the spring equinox to Rosh Chodesh Tevet is 8.5 to 9.5 lunar months
  • but from the spring equinox to the following winter solstice is 9 solar months (that is, three-quarters of a year), or about 9 x 235/228 = 9.28 lunar months – the 235 comes from the Metonic cycle embedded in the calendar, in which there are seven leap years out of 19.
  • so the new moon closest to the winter solstice is between 8.78 and 9.78 lunar months after the winter solstice… so it’s usually Rosh Chodesh Tevet (i. e. the new moon during Hanukkah) but not always.

Alternately, it was a big deal when Thanksgivukkah happened in 2013, when the first day of Hanukkah fell on Thanksgiving, November 28, 2013 (the first night of Hanukkah was the night before). That proves that Rosh Chodesh Tevet can be at least as early as December 4 (if Kislev is long), which is about 17 days short of the winter solstice, more than half a lunar month – and remember that typically the Hebrew month begins after the new moon. In fact, in the winter of 2013-14:

Similarly, one might guess that Rosh Hashanah is the new moon closest to the fall equinox… but by the same sort of argument it should be 5.5 to 6.5 lunar months after the spring equinox, and you need it to be six solar months, so it doesn’t always work out. I have heard it said that it’s a good thing Yom Kippur, on which the observant fast from sunset to sunset, falls at the time of year when the days are getting shorter the fastest.

Four points is not enough – the enumerative version

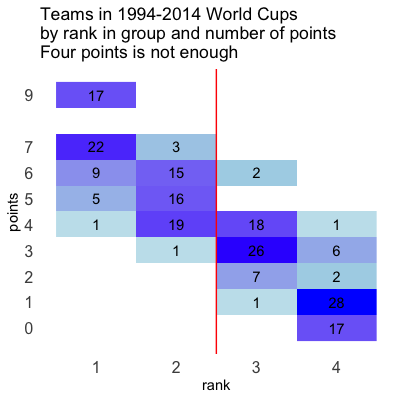
As I observed last week, four points is not enough to win one’s group in the World Cup. With four points (a win, a loss, and a draw) you have roughly a 50% chance of advancing to the knockout stage, based on historical data.

We can also verify this by working out all the possible results of a group. There are six games in each group, so 3^6 = 729 possibilities. If we weight each of these possibilities equally, it amounts to assuming that each game is a win for A, a draw, or a loss for A with equal probability. I wouldn’t want to do this with hand, but by computer it’s easy enough. As usual, using dplyr:

#flip(0) = 3, flip(1) = 1, flip(3) = 0
flip = function(x){(6-5*x+x^2)/2} 

#column xy is the number of points that team x gets in the game between x and y
#a, b, c, d: total number of points for each team
#a_place: place of team A
#a_tie: number of teams with same number of points as A
#p_advance: probability that A advances
#p_place1: probability that A is in first place
groups = expand.grid(ab = c(0,1,3), ac = c(0,1,3), 
                     ad = c(0,1,3), bc = c(0,1,3), 
                     bd = c(0,1,3), cd = c(0,1,3)) %>% 
  mutate(a = ab + ac + ad,
         b = flip(ab) + bc + bd,
         c = flip(ac) + flip(bc) + cd,
         d = flip(ad) + flip(bd) + flip(cd)) %>% 
  mutate(a_place = 4 - ((a >= b) + (a >= c) + (a >= d)), 
         a_tie = 1 + (a==b) + (a==c) + (a==d), 
         p_advance = ifelse(a_place >= 3, 0, 
                            ifelse(a_place + a_tie <= 3,  1, (3-a_place)/(a_tie))),
         p_place1 = ifelse(a_place >= 2, 0, ifelse(a_place + a_tie <= 2, 1, (2-a_place)/(a_tie)))
         )

The data frame groups has 729 rows, one for each possible outcome of the six games in the group. See the example below, where A, B, C, and D have 4, 4, 3, and 5 points respectively. One way to get this is in the first row:

  • A loses to B, A defeats C, A and D draw – 4 points for A
  • (B defeats A), B loses to C, B and D draw – 4 points for B
  • (C loses to A, C defeats B), C loses to D – 3 points for C
  • (D and A draw, D and B draw, D defeats C) – 5 points for D

and the other is in the second, which is the same with A and B interchanged.

groups %>% filter(a==4, b==4, c==3, d==5)
  ab ac ad bc bd cd a b c d a_place a_tie p_advance p_place1 p_place2
1  0  3  1  0  1  0 4 4 3 5       2     2       0.5        0      0.5
2  3  0  1  3  1  0 4 4 3 5       2     2       0.5        0      0.5

In each of these cases team a is in a two-way tie (a_tie) for second place (a_place); if ties are broken at random, then team a has a probability 0.5 to advance, all coming from second place. Of course ties aren’t broken at random, but I’m not going to model goal differential.

Then we can compute the probability of advancing with each possible point total by aggregation:

 groups %>% group_by(a) %>% summarize(prob = n()/3^6, prob_advance = mean(p_advance), prob_place1 = mean(p_place1))
# A tibble: 9 × 4
      a   prob prob_advance prob_place1
  <dbl>  <dbl>        <dbl>       <dbl>
1     0 0.0370       0          0      
2     1 0.111        0          0      
3     2 0.111        0.0123     0      
4     3 0.148        0.0787     0.00231
5     4 0.222        0.543      0.0216 
6     5 0.111        0.988      0.457  
7     6 0.111        0.975      0.469  
8     7 0.111        1          0.944  
9     9 0.0370       1          1     

To advance you need 7 points (to be sure); 5 will do except in freak cases. To win the group for sure you need 9 points, but 7 will do; 5 or 6 is a 50-50 shot. And we can plot it:

This reproduces what Greg Stoll found in 2014.

It’s natural to zoom in on the surprises:

  • how to advance with two points. Here you want a group with scores 9-2-2-2 – one team wins against the other three (including you), those three trade draws, and you win the tiebreaker, meaning you lost your game to the 9-pointer by the fewest goals.
  • how to win your group with three points. All six games must be draws, then you win the tiebreaker. (The first tiebreaker is goal difference, which would obviously be zero for all teams; the second is goals scored)
  • how to fail to advance with five points. This requires a group with scores 5-5-5-0 – one team loses all three of its games, the other three trade draws, and you lose the tiebreaker, meaning you win your game with the 0-pointer by the fewest goals. This is the reverse of the 9-2-2-2 group above.
  • how to fail to advance with six points. This requires a group with scores 6-6-6-0 – like the 5-5-5-0 group, except the three leading teams form a cycle of wins.

The first three have never happened in the World Cup; as I mentioned in my last post, the last one happened twice, both times in 1994.

If you want to know what probability a given team actually has of winning, see FiveThirtyEight. For the scenarios that cause it (including tiebreakers), see the NYT’s Upshot. The simplest scenario is that for the United States – if the US beats Iran today, they advance, otherwise they do not.

Press will buzz off, or, doubled letters at the ends of words

John D Cook wrote, following the latest episode of Kevin Stroud’s History of English podcast, that if a consonant at the end of a word is doubled, it’s probably S, L, F, or Z. It appears that some elementary school teachers teach a “doubled final consonant rule” that is roughly the converse of this: “If a short vowel word or syllable ends with the /f/, /l/, /s/, or /z/ sound, it usually gets a double f, l, s, or z at the end.”

That sounds right to me. Some other consonants seem doubleable but relatively rarely – G, N, and R came to mind, although the only words I could think of that actually end in those doubled are “egg”, “inn”, and “err” respectively. Those are probably instances of the three-letter rule, whereby “content words” tend to have at least three letters. (Walmart has a store-brand of electronics onn. (sic), as well.)

Cook writes: “These stats simply count words; I suspect the results would be different if the words were weighted by frequency.” Challenge accepted. Peter Norvig has some useful data, including “The 1/3 million most frequent words, all lowercase, with counts.”

counts = read_delim('https://norvig.com/ngrams/count_1w.txt', delim = '\t', col_names = c('word', 'count'))

counts %>% mutate(ult = str_sub(word, -1),
                  penult = str_sub(word, -2, -2)) %>%
  filter(!(ult %in% c('a', 'e', 'i', 'o', 'u'))) %>%
  mutate(double = (ult == penult)) %>%
  group_by(ult) %>% 
  summarize(double = sum(double*count), all = sum(count)) %>%
  mutate(pct_double = double/all * 100)

Result is as follows; the counts in columns “double” and “all” are numbers of words out of the “trillion-word” data set. So over one out of every four words ending in L, in ends in double-L; only 0.02% of words ending in Y end in double-Y. Norvig’s word counts come from the 2006 trillion-word data set from Alex Franz and Thorsten Brants at the Google Machine Translation Team coming from public web pages.

# A tibble: 21 × 4
   ult       double         all pct_double
   <chr>      <dbl>       <dbl>      <dbl>
 1 l     6881678966 24910774907    27.6   
 2 z       49070005   684008846     7.17  
 3 s     3928825545 84468484631     4.65  
 4 f      734823669 16788706705     4.38  
 5 x       85268118  3108416171     2.74  
 6 c      128294648  6294874635     2.04  
 7 j        7948601   390085263     2.04  
 8 b       49690347  2690064550     1.85  
 9 p       98252923  6905211199     1.42  
10 d      460147985 47335849371     0.972 
11 m       95423709 11371100313     0.839 
12 w       52402066  6908722748     0.758 
13 q        2645593   456516943     0.580 
14 t      295347877 52262740152     0.565 
15 n      238685552 49492910349     0.482 
16 v        3478513  1084201734     0.321 
17 g       51208927 19948325553     0.257 
18 r       58629294 38947533393     0.151 
19 k        8943711  8602400357     0.104 
20 h       13449679 14180781466     0.0948
21 y        7451329 35763181677     0.0208

The count for “L” is so high because of words like “all” and “will”. It turns out in this corpus my intuition about G, N, and R being plausible is spectacularly wrong. We can also get the five most common words ending in each double letter:

counts %>% mutate(ult = str_sub(word, -1),
                  penult = str_sub(word, -2, -2)) %>%
  filter(!(ult %in% c('a', 'e', 'i', 'o', 'u'))) %>%
  mutate(double = (ult == penult))  %>% filter(double) %>% group_by(ult) %>% mutate(rk = rank(-count)) %>% filter(rk <= 5) %>% summarize(paste(word, collapse = ', '))  %>% print(n = 21)

giving the following table:

# A tibble: 21 × 2
   ult   top5                                   
   <chr> <chr>                                  
 1 b     bb, phpbb, webb, bbb, cobb             
 2 c     cc, acc, gcc, fcc, icc                 
 3 d     add, dd, odd, todd, hdd                
 4 f     off, staff, stuff, diff, jeff          
 5 g     egg, gg, digg, ogg, dogg               
 6 h     hh, ahh, ahhh, ohh, hhh                
 7 j     jj, hajj, jjj, bjj, jjjj               
 8 k     kk, dkk, skk, fkk, kkk                 
 9 l     all, will, well, full, small           
10 m     mm, comm, hmm, hmmm, dimm              
11 n     inn, ann, lynn, nn, penn               
12 p     pp, app, ppp, supp, spp                
13 q     qq, qqqq, qqq, sqq, haqq               
14 r     rr, err, carr, starr, corr             
15 s     business, address, access, class, press
16 t     scott, matt, butt, tt, hewlett         
17 v     vv, vvv, rvv, vvvv, cvv                
18 w     www, ww, aww, libwww, awww             
19 x     xxx, xx, xnxx, xxxx, vioxx             
20 y     yy, yyyy, nyy, yyy, abbyy              
21 z     jazz, buzz, zz, jizz, azz  

and S, L, F, and Z do emerge as the only letters where the resulting words aren’t just junk. The rules seems to loosen for names (Matt, Scott, Hewlett; Ann, Lynn, Penn; Cobb). The data set betrays its internet origins here, with phpbb and libwww being relatively common.

I’ve found the pattern at the end of the code block above,

group_by(ult) %>% mutate(rk = rank(-count)) %>% filter(rk <= 5) %>% summarize(paste(word, collapse = ', '))

useful in practice for giving a quick summary of a table where there are many possible values of a second variable for each value of a first variable, and we just want to show which are most common.

Four points is not enough

The World Cup just started. As you may know, there are 32 teams, in eight groups of four. Each team in a group plays three games, one against each of the other teams in the group. The top two teams in each group advance to the “knockout round” of 16; teams get three points for a win, one point for a draw, and no points for a loss, so the most points a team can have is 9, the least is 0. (It’s not possible to get 8 points, but every other number is possible.)

So how many points is enough to advance?

With a quick Google I found this article from the Hindustan Times in 2018, saying that traditionally people think four points is enough, but in practice, 17 out of 33 teams with four points were in the top two in their group between 1994 and 2014. (By my count it’s 18 out of 35, which doesn’t materially impact the conclusion.). “Three points for a win” was introduced in the 1994 World Cup, so this is as far back as it’s meaningful to go.

Similarly, in the run-up to the current tournament, Fox Sports Australia writes: “Four points is really that magical mark that they need to aim at. You can miss the top two of your group with four points – 10 teams have done it across the last four World Cups – but the overwhelming majority of teams that reach that figure make it out.”

But if you stop to think about it for a moment, a win, a loss, and a draw (which is the only way to get four points) is a middling result, and you need to be in the top half to advance… this is best illustrated by 1994 group E, where all four teams got four points, and of course only two advanced.

And in Slate a couple days ago, Eric Betts wrote: “One win, one draw and one disheartening loss might be enough to get to the knockout rounds, but not necessarily. Two teams with four points advanced in 2018 and one—Iran—was sent home.” (There’s a slight error here – Argentina and Japan advanced with four points, Iran and Senegal didn’t.)

But if we go through and tabulate all 54 groups in the 1994 through 2018 World Cups (six groups in 1994, eight in each of 1998-2018) we really see that four points is not enough. Here’s a table of the teams by their rank in group and their number of points.

There’s an interesting anomaly here. Teams have not made the top two with six points – in 1994 both group D and group F had the point totals 6-6-6-0, with one team that was beaten by each of the other three, while the other three had a “cycle” of wins. (The third-place team in each of those groups advanced to the knockout round – in 1994 there were only six groups, as opposed to the current eight, so the top four third-place teams also advanced to the knockout round.). But no team has ever failed to advance with 5. (This is possible – a group where team A loses to B, C, and D, and all three games among B, C, D are ties, would have point totals 5-5-5-0.)

So you need five points to win (unless something weird happens.). Four is not enough.

When do the polls close for most people?

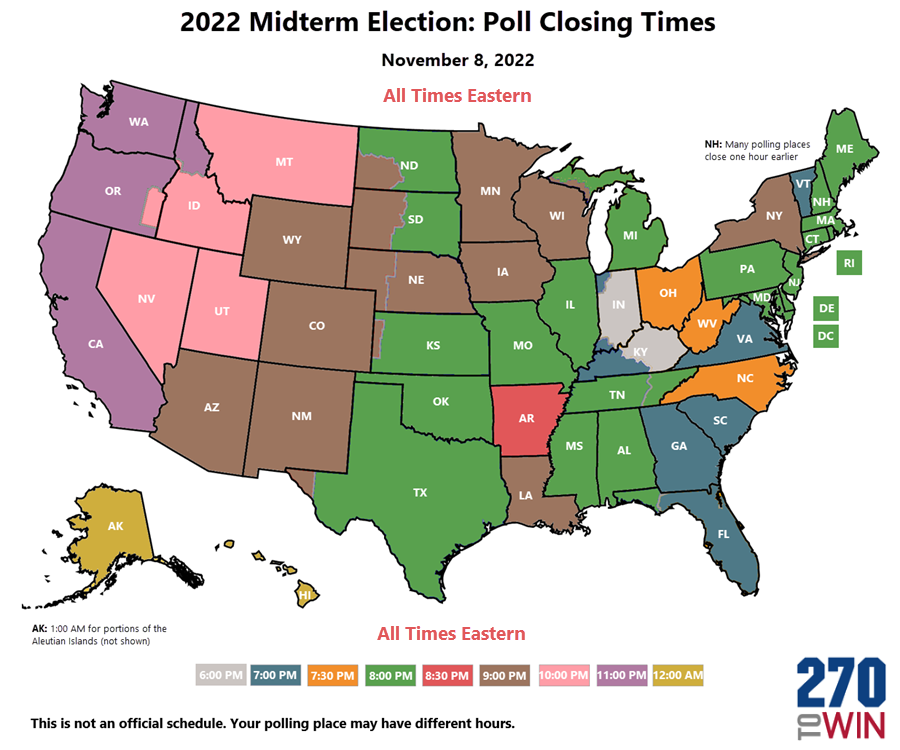
I tried to Google this and couldn’t – how many people live in places where the polls close tonight at time X, for each possible value of X? You can easily find a map of closing times, for example at 270towin.com:

But how many people do each of those colors represent?

The Green Papers has a nice table of poll closing times. The wrinkle is that in a state with multiple time zones, there are two possibilities:
  • polls close at the same clock time across the state. For example, in Florida, polls close at 7:00 PM everywhere in the state… as we learned in 2000 when it was called for Democrats before polls in the Panhandle (the westernmost part of the state, the only part on Central time, and a heavily Republican area) had closed. This is the method in Alaska, Florida, Idaho, Kansas, Kentucky, Michigan, North Dakota, South Dakota, and Texas.
  • polls close at the same real time across the state. This is what Nebraska does (8 Central / 7 Mountain) and Tennessee (8 Eastern / 7 Central).
We need to make some assumptions about what proportion of each split state is in each time zone. Fortunately, someone named “segacs” made a Sporcle quiz in 2015 which counted the population in each time zone worldwide, and broke down the results in a Google spreadsheet. We can just extrapolate those results forward – Tennessee was 34% Eastern time and 66% Central according to 2015 Census data, so we’ll just carry that forward to 2020. If everybody’s been leaving Knoxville and Chattanooga to move to Nashville and Memphis, we won’t know.

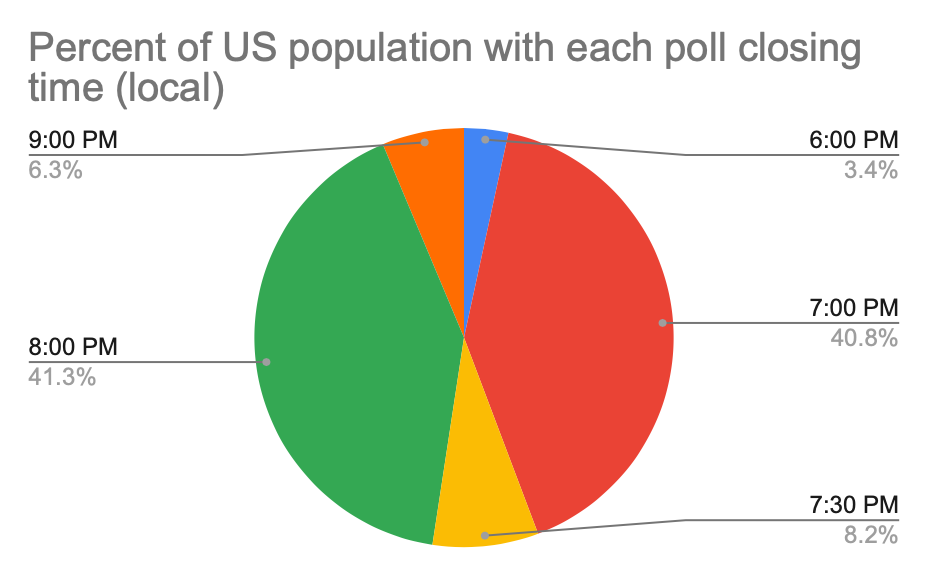
As it turns out, in most places the polls close at 7 or 8 local time, and those represent about equal numbers of people. The exceptions are:

  • Kentucky and Indiana (6 pm local)
  • North Carolina, Ohio, West Virginia, and Arkansas: 7:30 pm local
  • New York and North Dakota: 9 pm local. (Is there anything else New York and North Dakota have in common?)

The overall distribution is in the chart below.

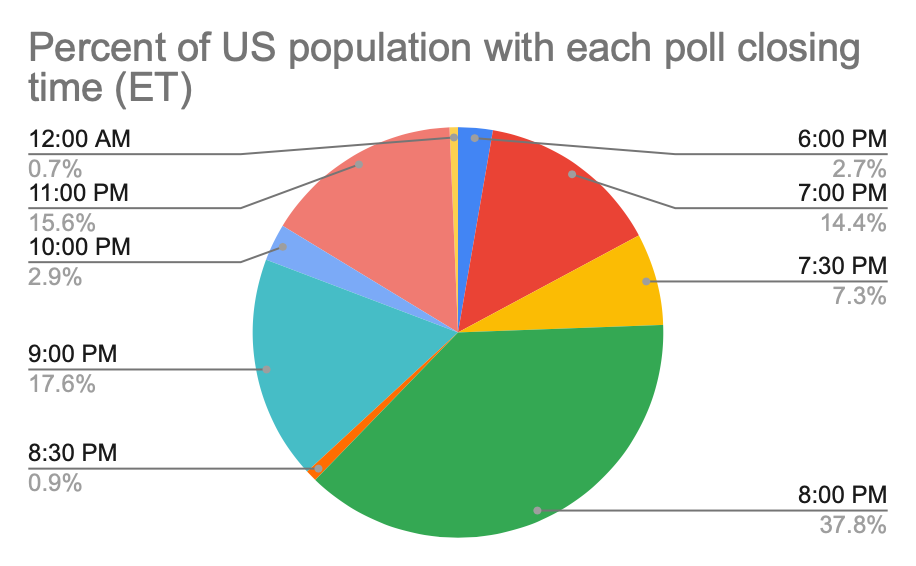
And in Eastern-time terms, the distribution is:

Both of these charts and the underlying data are at this Google spreadsheet.

This should be familiar to people who make a habit of watching the election returns roll in… you get the first substantial votes at 7, a big chunk at 8, and they trickle in over the rest of the night. (In presidential years the 11:00 chunk isn’t as interesting as you’d expect from its volume – the only polls closing at 11 are California, Oregon, Washington, and small portions of North Dakota and Idaho, and if any of those states are competitive the election as a whole is not.)

Too small to show on the chart is the polls that close at 1 AM. Those are the polls that close at 8 PM (Hawaii-)Aleutian time (UTC-10, five hours behind Eastern time), in that part of the Aleutian Islands of Alaska west of 169° 30′ W longitude. In terms of populated places it looks like this is a really long-winded way of saying Adak. Adak has 326 people. The biggest settlement in the Aleutians, Unalaska, is only at 166° 32′ W and is therefore in UTC-9, “Alaska time”. Brian Brettschneider, Alaska-based climatologist, called out Adak in 2016:

https://platform.twitter.com/widgets.js

and at least a cursory look at a list of Alaska polling places suggests there are two in the Aleutians, “Aleutians No. 1” in Adak and “Aleutians No. 2” in Unalaska. It seems quite reasonable that there is only one polling place, the one in Adak, that closes at 1 AM Eastern. This oddity has been mentioned before, in 2012 and 2016, in both cases by local sources. In 2016 five people voted after 8 PM Alaska / 7 PM Aleutian (midnight Eastern).

Not that anything will be called in Alaska when the polls close… Alaska uses ranked-choice voting, so it’ll take a while to count the votes anyway.

Does Game 3 have some special magic?

Saw a “statistic” during game 3 of the World Series yesterday – teams that have won Game 3 have gone on to win 68 times out of 98 (69%).

First of all, 98 is a strange denominator there… that would be “since 1923”, but the first World Series was played in 1903! But 1922 was the last time there was a tied game in a World Series, so is this presumably 1923 through 2021 (99 years) with the exception of 1994?

You can find this statistic in, for example, this CBS Sports item or this tweet from @MLB: https://platform.twitter.com/widgets.js

Okay, turns out I misheard it – it’s the winner of all Game Threes in best-of-seven MLB postseason series when the first two games were split 1-1.

So is this surprising? Not really… the winner of such a Game Three has to win at least two out of the next four to win the series. If games are coin flips, that happens 11/16 of time (69%). Game Three doesn’t have some special magic… it’s just the a 2-1 lead is substantial.

This post should be going out at the first pitch of Game 4. Go Phillies!

How many states are south of Mexico?

The site barelybad.com asks:

How many U.S. states have any portion of their borders north of the southernmost part of Canadian land?

In short, “how many states are north of Canada?”, although this is a bit disingenuous as, say, It’s not a trick question, “Canada” is the bit you’re used to seeing on maps. Here’s the answer. Here’s a blog post with a map.

So, then, how many states are south of Mexico? More formally: how many U. S. states have any portion of their borders south of the northernmost part of Mexican land?

This one Is a bit easier, I think.

Obviously you have Hawaii.

All of the southernmost tier of states are included – California, Arizona, New Mexico, Texas, Louisiana, Mississippi, Alabama, Georgia, Florida. California is the surprising one, I think, but the border doesn’t actually run due east-west in California. The border was defined by the Treaty of Guadalupe Hidalgo (which ended the Mexican-American War) to be a line from the junction of the Colorado and Gila rivers (near Yuma, Arizona) to a point one Spanish league south of the southernmost point of San Diego Bay; that point where the Colorado and Gila meet is the northernmost point of Mexico. This point was hard to find in reality, according to Joel Levanetz of the San Diego Historical Society. The adjacent Mexican town, Los Algodones, Baja California, apparently does a thriving business in dental tourism. Google gives the coordinates of that northeastern corner as 32.71865 N, 114.71972 W.

That the eastern states have land south of this isn’t so obvious. But it happens that I know that Atlanta and Los Angeles are at about the same latitude (34 degrees north) and there’s a lot more Georgia south of Atlanta than there is California south of Los Angeles.

South Carolina and Arkansas are the only really questionable states from eyeballing a map. Below is a screenshot of the Google map of the US… note that Google uses Web Mercator so horizontal lines on the map are actually lines of latitude.

Map of US with northernmost point of Mexico circled

The southern border of Arkansas (with Louisiana) is the 33rd parallel north, so no part of Arkansas is south of any part of Mexico. See for example the Encyclopedia of Arkansas. When the border was established, it was the border between the District of Orleans (present-day Louisiana) and the District of Louisiana (present-day Arkansas).

As for South Carolina, a line heading due east through the northernmost point of Mexico passes through it. This line was drawn with the highly advanced technology of “opening the screenshot up in Preview and drawing it, holding down the Shift key to make sure the line was horizontal”:

As you can see the area below the line takes in a tiny sliver of California, portions of Arizona, New Mexico, and Texas, nearly all of Louisiana, about half of Mississippi, Alabama, and Georgia, all of Florida, and a small bit of South Carolina. The line passes just south of Charleston:

This is also a quiz on Sporcle that I played once, in 2017. I got 10 out of 11; I don’t know which one I missed.

A hat tip is due to this Reddit post which got me thinking about this.